Critical communication network augmentation using broadband

About Tait
For more than 50 years, Tait Communications has been designing, delivering and supporting critical communications networks for public safety, transportation and utility customers around the world. We support our customers from regional bases that cover the Americas, Asia Pacific, Europe, Middle East, and Africa. The hub of our global operations is in Christchurch, New Zealand and includes our principal design, engineering, and manufacturing facilities. Our campus sits at the hub of a network of suppliers and partners that fuels our local, regional and national economies. We believe we can make the world a safer, better, and more efficient place.
The problem
Create a real time, self adapting analytics system for determining the current health, performance and customer perception of our Broadband Voice Communications system.
Background
In the last decade Tait has introduced a number of products and services that can operate on and utilise public cellular network infrastructure. The latest manifestation of this is a Push to Talk (PTT) voice service that is targeted at customers that want to have a PTT radio like experience while using a cellular network. The PTT over broadband solution Tait has developed offers many of the features that our customers have come to expect from our existing products. The feature that is most relevant for this project is the group call, a voice call that includes anywhere from 2 to 2000 devices.
With the introduction of these broadband devices Tait has less control over the end to end system, due to the reliance on public or customer hosted broadband infrastructure, but at the same time has significantly more access to diagnostic information from the end devices. The object of this project is to come up with a methodology for utilizing the increased access to data to provide a scalable, adaptive and insightful analytics platform to monitor the status of the system in real time, while providing insights into feature usage, user behaviors, trends and general system performance.
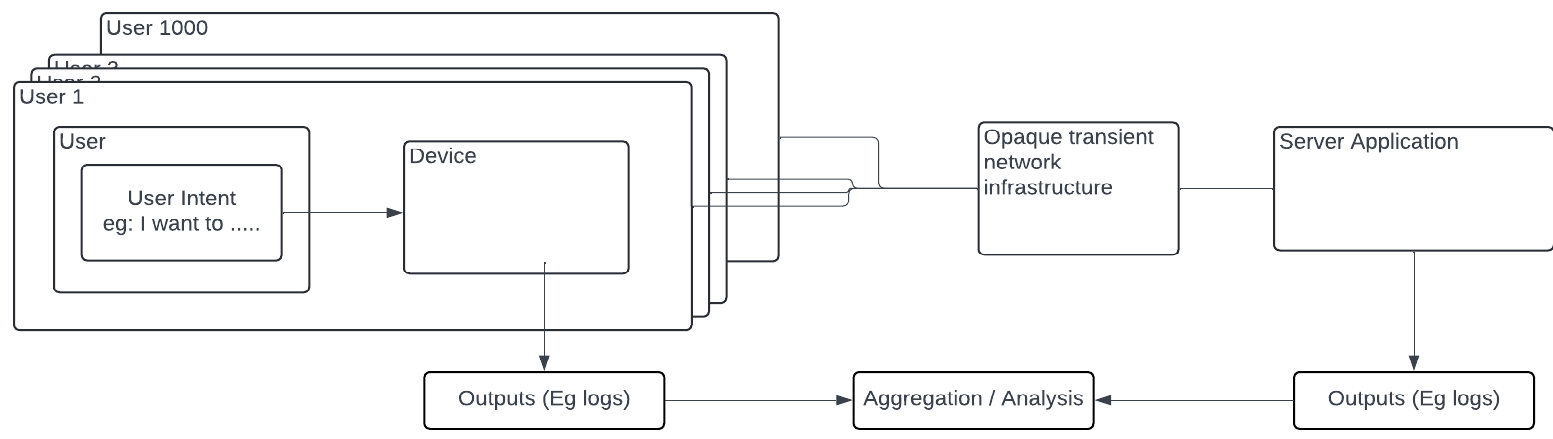
The diagram below breaks down the problem into a number of components. The most important actor in the system is the end user and specifically their actions or intent. It is however hard to collect data from the user directly, which is discussed more below in the analysis outputs. The diagram also highlights the components in the system that data can be collected from.
The following is a list of possible analysis outputs which could be extracted using the data provided.
- Detecting user expectation anomalies:
The user pushed a button on the device, given the current context this probably means they want to make a call to other devices. If this call doesn’t proceed for any reason the user would be surprised, representing a user expectation anomaly. - Call behavior anomalies:
During a call a user expects to be able to transmit uninterrupted audio to everyone else in the call (maybe 1000’s of other devices). If another device doesn’t receive all of this audio then this would be a call behavior anomaly. - System Performance:
Radio networks have a very deterministic performance profile for metrics like call setup time, audio delay, jitter etc. Due to the transient nature of the broadband network, that the new system relies on, tracking system performance, from the user perspective, is highly valuable. - Trends:
Over time trends may emerge, for examples Anomalies or performance issues may occur at specific locations, certain times of day, particular devices, or particular users. Identifying these trends help with the identification of the root cause of the anomalies or performance issues. - System health:
There are many systems around the world being operated concurrently by a number of different customers, and anomalies and performance issues need to be aggregated into a single entity that represents the health of the system overall. This likely requires a weighting system to determine the severity of any given issue while taking into account user impact and occurrence rate. - Insights:
Detecting trends around user expectations and behaviors, both positive and negative. A possible insight output could be a weighted summary of severity of anomaly versus occurrence rate vs global usage of the feature.